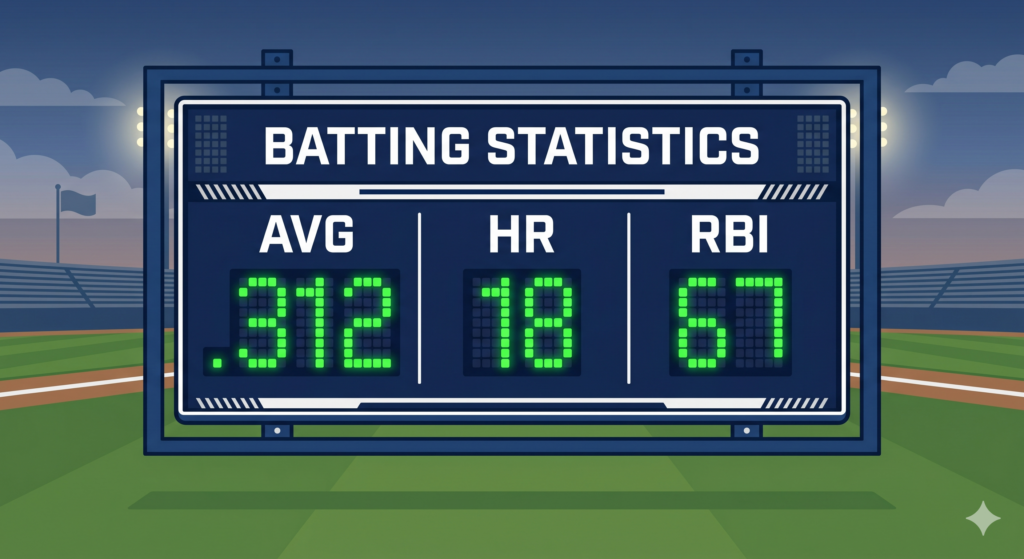
You’re watching a baseball game. The announcer says:
“He’s hitting .312 on the season with 18 home runs and 67 RBIs.”
You kind of nod along. But do you actually know what those numbers mean? Do you know whether .312 is good or great? Whether 67 RBIs by June is impressive or average?
By the end of this post, you will.
Baseball has more statistics than almost any other sport. That’s part of what makes it so fascinating — and so overwhelming for newcomers. Today we’re going to cover the traditional batting statistics that have been used for over a century to measure how well a hitter is performing.
Let’s go through them one by one.
1. Batting Average (AVG)
What it is: The most iconic statistic in baseball. Batting average measures how often a batter gets a hit per at-bat.
Formula:
Batting Average = Hits ÷ At-Bats
Example: If a player has 150 hits in 500 at-bats:
150 ÷ 500 = .300 batting average
Batting averages are always expressed as a three-digit decimal — so .300 is read as “three hundred.”
What’s a good batting average?
| AVG | Assessment |
|---|---|
| .200 or below | Poor — often called “the Mendoza Line” |
| .250 | Below average |
| .270–.290 | Solid, league average range |
| .300+ | Very good — an elite hitter |
| .330+ | Exceptional — MVP-caliber |
Historically, a .300 batting average has been the benchmark for a quality hitter. However, batting averages across MLB have declined over the decades as strikeouts have increased. Today, even a .280 hitter is considered above average.
Limitation: Batting average treats all hits equally. A bloop single counts the same as a 450-foot home run. It also ignores walks entirely. This is why batting average alone doesn’t tell the full story — which is why we have additional statistics.
2. Home Runs (HR)
What it is: The number of home runs a player has hit. Simple, iconic, and universally understood.
A home run occurs when the batter hits the ball over the outfield wall in fair territory. Every runner on base — including the batter — automatically scores.
What’s a good home run total?
| HR (per season) | Assessment |
|---|---|
| 10–15 | Below average for a power hitter |
| 20–25 | Solid, contributes power to the lineup |
| 30–35 | Very good — established power hitter |
| 40+ | Elite power — All-Star level |
| 50+ | Exceptional — historic season |
The single-season MLB home run record is 73, set by Barry Bonds in 2001 (though his era is associated with performance-enhancing drugs). The all-time career record is 762, also held by Bonds.
Among active players, Shohei Ohtani has been one of the most dominant home run hitters, regularly competing for the league lead.
Fun fact: A home run with the bases loaded — scoring 4 runs at once — is called a grand slam, the most exciting single play in baseball.
3. Runs Batted In (RBI)
What it is: RBI counts the number of runs that score as a direct result of a batter’s plate appearance — whether through a hit, a walk with bases loaded, a sacrifice fly, or other means.
Example: Bases loaded, batter hits a single. Two runners score. That’s 2 RBIs for the batter.
What’s a good RBI total?
| RBI (per season) | Assessment |
|---|---|
| 50–60 | Below average for a run producer |
| 70–80 | Solid contributor |
| 90–100 | Very good — quality cleanup hitter |
| 100+ | Elite — All-Star level |
| 130+ | Exceptional — MVP candidate |
Important context: RBI totals are heavily influenced by where a player bats in the lineup and how many runners are on base when they come up. A player batting third or fourth (the “cleanup” spot) will naturally accumulate more RBIs than an equally talented player batting leadoff, simply because more runners are on base for them.
This is one of the main criticisms of RBI as a statistic — it measures opportunity as much as it measures skill.
4. Runs Scored (R)
What it is: The number of times a player personally crosses home plate and scores a run.
While RBI credits the batter who drives in a run, Runs credits the player who actually scores. A player can score a run after getting a hit, drawing a walk, or reaching base by any other means — and then advancing home on a teammate’s hit.
What’s a good Runs total?
| Runs (per season) | Assessment |
|---|---|
| 60–70 | Below average |
| 80–90 | Solid |
| 100+ | Very good — typically leadoff or #2 hitters |
| 120+ | Elite |
Runs and RBIs together give a more complete picture of a player’s offensive contribution than either stat alone.
5. Stolen Bases (SB)
What it is: The number of times a player successfully steals a base — advancing to the next base while the pitcher is throwing, without the ball being hit.
Stolen bases measure speed and baserunning instinct. A player who steals 30+ bases in a season is considered a genuine threat on the basepaths.
What’s a good stolen base total?
| SB (per season) | Assessment |
|---|---|
| 10–15 | Decent speed |
| 20–30 | Solid baserunner |
| 40+ | Elite speed — game-changing threat |
| 60+ | Historic — among the best ever |
Korean connection: Hyeseong Kim of the Los Angeles Dodgers is one of the fastest players in MLB, known for his elite stolen base ability. His speed is a major part of his value to the team.
Important note: Stolen base attempts aren’t always successful. A player who attempts 40 steals but gets caught 20 times is actually hurting their team. Stolen base percentage (success rate) matters as much as raw total.
6. On-Base Percentage (OBP)
What it is: OBP measures how often a batter reaches base — through hits, walks, or being hit by a pitch. It’s a more complete measure of a batter’s ability to avoid making outs than batting average.
Formula:
OBP = (Hits + Walks + Hit by Pitch) ÷
      (At-Bats + Walks + Hit by Pitch + Sacrifice Flies)
Example: A player with 150 hits, 80 walks, and 5 HBP in 550 plate appearances:
(150 + 80 + 5) ÷ (500 + 80 + 5 + 10) = .403 OBP
What’s a good OBP?
| OBP | Assessment |
|---|---|
| .290 or below | Poor |
| .320 | League average |
| .350–.370 | Very good |
| .400+ | Elite — truly special hitter |
| .480+ | Historic — all-time great territory |
Ted Williams holds the all-time single-season OBP record at .553 in 1941 — meaning he reached base more than half the time that year. It remains one of the most remarkable achievements in sports history.
Why OBP matters: The most important thing an offensive player can do is not make outs. Every out brings the inning closer to ending. A player who walks a lot may have a lower batting average but still be more valuable than a free swinger who hits .280 with no walks.
This insight — that OBP is more valuable than batting average — was the core argument of the book Moneyball, which we’ll cover in depth later in this series.
7. Slugging Percentage (SLG)
What it is: Slugging percentage measures the power of a hitter by calculating the average number of bases gained per at-bat.
Formula:
SLG = Total Bases ÷ At-Bats

Total Bases:
Single = 1 base
Double = 2 bases
Triple = 3 bases
Home Run = 4 bases
Example: A player with 100 singles, 30 doubles, 5 triples, and 30 home runs in 500 at-bats:
(100×1) + (30×2) + (5×3) + (30×4) = 100 + 60 + 15 + 120 = 295 total bases
295 ÷ 500 = .590 SLG
What’s a good slugging percentage?
| SLG | Assessment |
|---|---|
| .350 or below | Poor |
| .400 | Below average |
| .450 | Solid |
| .500+ | Very good — legitimate power hitter |
| .550+ | Elite |
| .600+ | Exceptional — MVP-caliber power |
8. OPS (On-Base Plus Slugging)
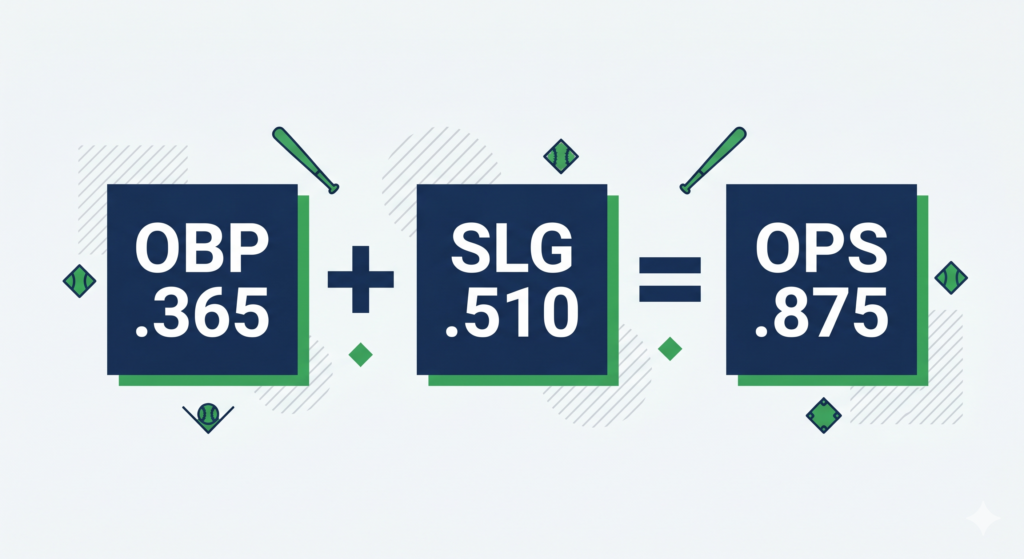
What it is: OPS is simply OBP + SLG combined into one number. It’s a quick and effective way to measure a hitter’s overall offensive value — capturing both their ability to get on base and their power.
Formula:
OPS = OBP + SLG
What’s a good OPS?
| OPS | Assessment |
|---|---|
| .600 or below | Poor |
| .700 | Below average |
| .750 | League average |
| .800 | Solid — above average hitter |
| .900 | Very good — All-Star level |
| 1.000+ | Elite — MVP candidate |
| 1.100+ | Historic — one of the best seasons ever |
OPS is one of the most useful traditional stats because it combines two important dimensions of hitting into one simple number. It’s not perfect — we’ll get into its limitations when we cover advanced stats — but it’s a massive improvement over batting average alone.
Putting It All Together: A Real Example
Let’s look at a fictional player’s stat line and interpret it:
Player: .285 AVG / 28 HR / 95 RBI / 88 R / 18 SB / .365 OBP / .510 SLG / .875 OPS
Reading this:
- .285 AVG — Above average bat-to-ball contact
- 28 HR — Solid power, borderline All-Star
- 95 RBI — Quality run producer, likely bats 3rd or 4th
- 88 R — Scores frequently, good baserunner
- 18 SB — Respectable speed
- .365 OBP — Gets on base at a good clip, patient at the plate
- .510 SLG — Real power threat
- .875 OPS — Overall, a very good offensive player, probably an All-Star
This type of player would be considered one of the better hitters in the league.
Key Stats Quick Reference
| Stat | Measures | Good Number |
|---|---|---|
| AVG | Hit rate | .300+ |
| HR | Home runs | 30+ |
| RBI | Runs driven in | 100+ |
| R | Runs scored | 100+ |
| SB | Speed/baserunning | 30+ |
| OBP | Getting on base | .350+ |
| SLG | Power | .500+ |
| OPS | Overall offense | .850+ |
Final Thoughts
These traditional stats have told baseball’s story for over 100 years — and they still do. Even today, when advanced analytics dominate front office decisions, fans and broadcasters still talk about batting average, home runs, and RBIs constantly.
Understanding these numbers gives you the foundation to follow the game and evaluate players. But they’re just the beginning.
In the next post, we’ll look at traditional pitching stats — ERA, WHIP, strikeouts, wins, and more. Then, a few posts later, we’ll get into the world of sabermetrics, where we’ll discover why some of these traditional stats are more misleading than they appear.
See you there.
— BaselineJay
Disclaimer: This post is for informational and educational purposes only. All statistical benchmarks referenced are based on historical MLB data.
Previously: Baseball Rules Explained: How a Game Actually Works ←
Up Next: Traditional Pitching Stats Explained: ERA, WHIP, Wins & Strikeouts →