
In the last post, we covered batting stats — how to read a hitter’s numbers and know whether they’re good or great. Now it’s time to flip to the other side of the ball.
Pitching is the foundation of baseball. As the old saying goes: “Good pitching beats good hitting.” And the numbers that measure pitching performance are just as rich and interesting as those that measure hitting.
Today we’re breaking down the traditional pitching statistics — the ones you’ll hear broadcasters mention constantly, the ones that have been tracked for over a century, and the ones every baseball fan should understand.
Let’s get into it.
A Quick Note on Pitcher Types
Before we dive into the stats, it helps to know that not all pitchers do the same job. MLB pitching staffs are divided into two main groups:
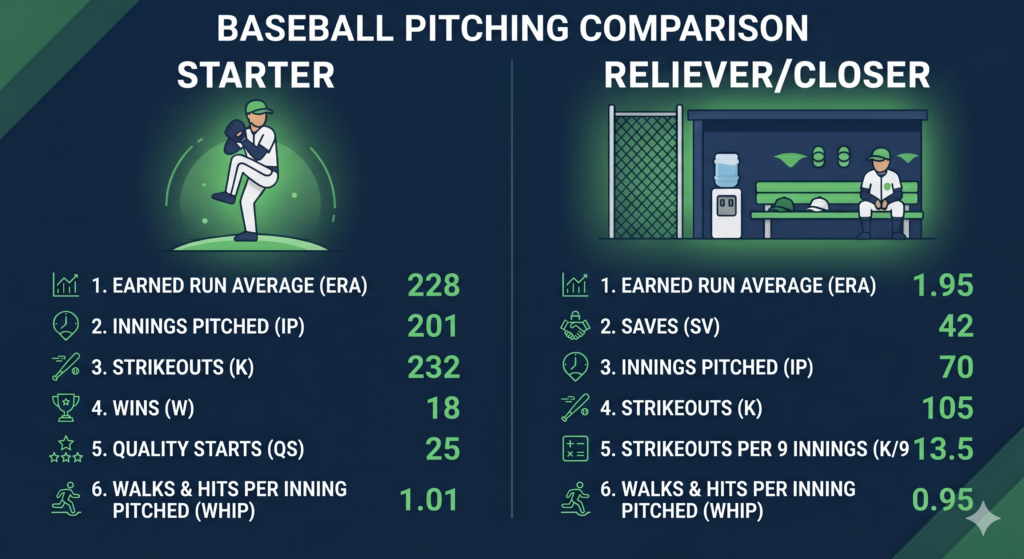
Starters (Starting Pitchers): Pitch at the beginning of the game. Expected to throw 5–7 innings. Each team uses 5 starters who rotate in a set order — this is called the rotation.
Relievers (Bullpen): Come in after the starter. There are different types:
- Setup men — pitch in the 7th and 8th innings
- Closer — the team’s best reliever, typically pitches the 9th inning to preserve a lead
- Middle relievers — fill innings in the middle of the game
1. Earned Run Average (ERA)
What it is: ERA is the most important traditional pitching statistic. It measures how many earned runs a pitcher allows per 9 innings pitched.
Formula:
ERA = (Earned Runs Allowed ÷ Innings Pitched) × 9
Example: A pitcher allows 80 earned runs over 200 innings:
(80 ÷ 200) × 9 = 3.60 ERA
What’s a good ERA?
| ERA | Assessment |
|---|---|
| 6.00+ | Poor |
| 5.00–5.99 | Below average |
| 4.00–4.99 | League average range |
| 3.50–3.99 | Good |
| 3.00–3.49 | Very good |
| 2.50–2.99 | Elite |
| Below 2.50 | Historic — Cy Young territory |
Korean connection: Ryu Hyun-jin (류현진) posted a 2.32 ERA in 2019, leading the entire National League — one of the best seasons by a Korean pitcher in MLB history.
2. Wins and Losses (W-L)
What it is: Tracks how many games a pitcher was the pitcher of record when their team won or lost.
What’s a good W-L record?
| Wins (per season) | Assessment |
|---|---|
| 8–10 | Below average |
| 12–14 | Solid rotation piece |
| 15–17 | Good — potential All-Star |
| 18–20 | Very good — Cy Young consideration |
| 20+ | Elite — historic milestone |
Important caveat: Wins and losses are one of the most misleading stats in baseball. A pitcher can throw 8 brilliant innings, allow 1 run, and still lose 1-0 if their offense doesn’t score. This is why advanced stats have largely replaced wins as a meaningful measure — which we’ll cover in the sabermetrics posts.
3. WHIP (Walks + Hits per Inning Pitched)
What it is: WHIP measures how many baserunners a pitcher allows per inning.
Formula:
WHIP = (Walks + Hits) ÷ Innings Pitched
What’s a good WHIP?
| WHIP | Assessment |
|---|---|
| 1.50+ | Poor |
| 1.30–1.49 | Below average |
| 1.20–1.29 | League average |
| 1.10–1.19 | Good |
| 1.00–1.09 | Very good |
| Below 1.00 | Elite |
4. Strikeouts (K) and K/9
What it is: The number of batters a pitcher retires via strikeout.
What’s a good strikeout total?
| K (per season) | Assessment |
|---|---|
| 100–130 | Below average |
| 150–170 | Solid |
| 200–220 | Very good — ace level |
| 250+ | Elite |
| 300+ | Historic |
K/9 Formula:
K/9 = (Strikeouts ÷ Innings Pitched) × 9
| K/9 | Assessment |
|---|---|
| 6.0–7.0 | Below average |
| 8.0–9.0 | Average |
| 10.0–11.0 | Good |
| 12.0+ | Elite |
5. Walks (BB) and BB/9
What it is: The number of walks a pitcher issues. Walks are free baserunners — essentially giving the opponent something for nothing.
| BB/9 | Assessment |
|---|---|
| 4.0+ | Poor — serious control issues |
| 3.0–3.9 | Below average |
| 2.5–2.9 | Average |
| 2.0–2.4 | Good |
| 1.5 or below | Elite control |
6. Innings Pitched (IP)
What it is: Total innings thrown. A starter who consistently pitches 6+ innings preserves the bullpen.
| IP (per season) | Assessment |
|---|---|
| Below 150 | Below average or injury-shortened |
| 160–175 | Average |
| 180–195 | Good |
| 200+ | Very good — workhorse |
| 220+ | Elite durability |
7. Quality Start (QS)
A quality start is awarded when a starter pitches at least 6 innings and allows 3 or fewer earned runs. A 65%+ quality start rate is considered solid for a starting pitcher.
8. Saves (SV) and Holds (HLD)
Saves: A closer earns a save by protecting a lead of 3 runs or fewer to end the game. 35+ saves in a season is elite.
Holds: Awarded to setup relievers who enter in a save situation, record at least one out, and leave with the lead intact.
Putting It All Together
Let’s read a fictional ace pitcher’s stat line:
15-7 W-L | 3.12 ERA | 1.08 WHIP | 210 IP | 228 K | 52 BB
- 15-7 — Strong record with good team support
- 3.12 ERA — Excellent, well below league average
- 1.08 WHIP — Elite, very few baserunners allowed
- 210 IP — Workhorse, durable all season
- 228 K — Elite strikeout total
- 52 BB — K/BB ratio of 4.4 is outstanding
Verdict: True ace — a Cy Young Award candidate.
Key Stats Quick Reference
| Stat | Measures | Good Number |
|---|---|---|
| ERA | Runs allowed per 9 IP | Below 3.50 |
| W-L | Win-loss record | 15+ wins |
| WHIP | Baserunners per inning | Below 1.10 |
| K | Strikeouts | 200+ per season |
| K/9 | Strikeout rate | 10.0+ |
| BB/9 | Walk rate | Below 2.5 |
| IP | Durability | 200+ per season |
| QS% | Consistency | 65%+ |
| SV | Saves (closers) | 35+ |
Final Thoughts
These traditional pitching stats tell a rich story — but like batting stats, they have real limitations. Wins are heavily team-dependent. ERA can be affected by the defense behind the pitcher. That’s exactly why sabermetrics developed new, more accurate measures.
We’ll cover those soon. But first, we’re heading back to the ETF series for one more post before returning to baseball’s advanced analytics.
— BaselineJay
Disclaimer: This post is for informational and educational purposes only. All statistical benchmarks referenced are based on historical MLB data.
Previously: Traditional Batting Stats Explained ←
Up Next: What is Sabermetrics? How Moneyball Changed Baseball Forever →