
It’s 2002. The Oakland Athletics have just lost three of their best players to free agency. Their payroll is one of the lowest in baseball. By every traditional measure, they should be heading for a disastrous season.
Instead, they win 20 games in a row — an American League record at the time — and make the playoffs.
How? By doing something no team had done before at scale: using data and statistics to find undervalued players that everyone else was ignoring.
That story became the book — and later the movie — Moneyball. And the approach behind it? That’s sabermetrics.
What is Sabermetrics?
Sabermetrics is the use of advanced statistical analysis to evaluate baseball players and teams more accurately than traditional statistics allow.
The term comes from SABR — the Society for American Baseball Research — a group of baseball enthusiasts and analysts who began developing new ways to measure the game in the 1970s and 1980s.
The man most associated with popularizing sabermetrics is Bill James, a baseball writer and statistician who spent decades developing new metrics and challenging conventional wisdom about how players should be evaluated.
His central argument was simple but revolutionary: traditional baseball statistics are full of flaws, and there are better ways to measure what actually wins games.
What’s Wrong With Traditional Stats?
In the last two posts, we covered traditional batting stats (AVG, HR, RBI) and pitching stats (ERA, Wins, WHIP). They’re useful — but they have serious limitations.
Here’s a quick recap of the problems:
Batting Average (AVG) Treats a single the same as a home run. Ignores walks entirely. Doesn’t measure actual run-creation ability.
RBI (Runs Batted In) Depends heavily on how many runners are on base when a player bats. A great hitter batting 8th will accumulate far fewer RBIs than an average hitter batting cleanup — even if the 8th-place hitter is the better player.
Pitcher Wins A pitcher can throw 8 shutout innings and lose because his offense scored zero runs. Another pitcher can allow 5 runs in 5 innings and win because his team scored 10. Wins measure the team’s performance, not the individual pitcher’s.
ERA Affected by the defense behind the pitcher. A pitcher with poor fielders behind him will have an inflated ERA through no fault of his own.
Sabermetrics was developed to fix these problems — to find statistics that more accurately measure what a player actually contributes, independent of their teammates and circumstances.
The Moneyball Revolution
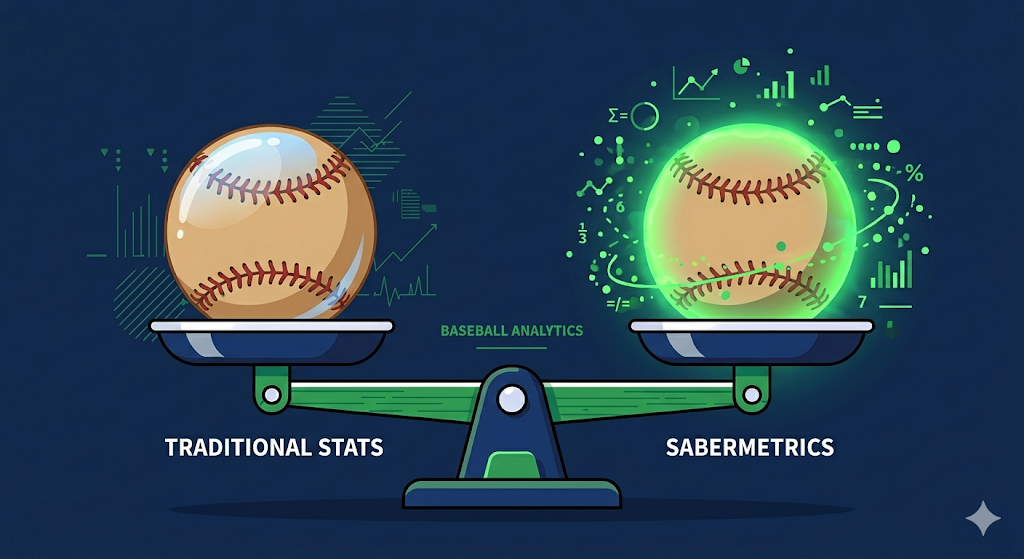
In 2002, Oakland Athletics General Manager Billy Beane — working with Harvard-educated analyst Paul DePodesta — put sabermetric principles into practice at the team level for the first time.
Their key insight: on-base percentage (OBP) was dramatically undervalued by the market.
Traditional scouts evaluated players on the “five tools”: hitting for average, hitting for power, speed, arm strength, and fielding ability. The ability to draw walks — to get on base without getting a hit — was largely ignored.
Beane and DePodesta noticed something in the data: the most important thing an offense can do is not make outs. Every out brings the inning closer to ending. Players who drew lots of walks — even if they weren’t flashy — were enormously valuable because they extended innings and created scoring opportunities.
By targeting players with high OBP who were ignored or undervalued by other teams (because they didn’t look like traditional ballplayers), the Athletics were able to build a competitive roster on a fraction of the budget of teams like the Yankees.
The result: 103 wins in 2002, the 20-game winning streak, and a playoff appearance — achieved with one of the lowest payrolls in baseball.
Moneyball proved that data could find value that human scouts were missing.
How Sabermetrics Works: The Core Idea
The foundation of sabermetrics is a concept called run value — the idea that every play in baseball can be assigned a value based on how much it increases or decreases a team’s expected runs scored.
For example:
- A walk is worth approximately +0.30 runs
- A single is worth approximately +0.47 runs
- A home run is worth approximately +1.40 runs
- A strikeout is worth approximately -0.30 runs
By summing up these run values across all of a player’s plate appearances, analysts can calculate exactly how many runs a player created or prevented — far more precisely than traditional stats.
This run-value framework is the engine behind most modern advanced statistics.
Key Sabermetric Concepts
Replacement Level
One of the most important concepts in sabermetrics is the idea of a replacement-level player — the baseline performance you could get for free by calling up a minor leaguer or signing a journeyman off the waiver wire.
A replacement-level player isn’t a bad player — they’re freely available. The question isn’t “is this player good?” but “is this player better than what I could get for free?”
This concept is central to the most important sabermetric statistic: WAR (Wins Above Replacement), which we’ll cover in depth in the next post.
Context Independence
Traditional stats are heavily influenced by context — the ballpark, the lineup, the defense behind you. Sabermetrics tries to strip away context to measure what a player actually contributes independently.
For example:
- Did a pitcher’s ERA go up because he pitched poorly? Or because he had a weak defense behind him?
- Did a hitter’s RBI total go up because he improved? Or because his lineup improved and more runners were on base?
Advanced stats try to answer these questions by isolating individual performance from team context.
Park Factors
Not all ballparks are equal. Coors Field in Denver — with its thin altitude air — inflates offense significantly. Pitcher-friendly parks suppress it. Sabermetrics uses park factors to adjust statistics for the environment where they were recorded.
A .290 hitter at Coors Field might actually be less impressive than a .270 hitter at a pitcher’s park. Park-adjusted statistics account for this.
Sabermetrics Today: From Fringe to Mainstream
When Bill James first published his Baseball Abstracts in the early 1980s, he was largely dismissed by the baseball establishment. His ideas were considered too theoretical, too numbers-focused, not respectful enough of “the game.”
Today, every single MLB team employs a full analytics department. The question isn’t whether to use sabermetrics — it’s how to use it most effectively.
The Houston Astros used advanced analytics to build one of the most dominant dynasties in modern baseball, winning the World Series in 2017 and consistently competing for championships throughout the 2010s and 2020s.
The Tampa Bay Rays — another low-payroll team like the 2002 Athletics — have used analytics to consistently compete with far wealthier teams, pioneering concepts like the “opener” strategy (using a relief pitcher to start the game) that are now common across the league.
Even individual players now work with their own analysts. Pitchers use data to redesign their arsenal — a concept called pitch design — to maximize effectiveness. Hitters study launch angle and exit velocity data to optimize their swings.
Sabermetrics didn’t just change how teams evaluate players. It changed how the game is played.
The Pushback: What Sabermetrics Gets Wrong
Sabermetrics has its critics — and some of the criticism is valid.
It can miss intangibles. Leadership, work ethic, clutch performance under pressure, chemistry — these things matter, and they’re hard to quantify. A player with slightly worse stats but exceptional leadership might be more valuable to a team than the numbers suggest.
It can be overfit. With enough data, you can find statistical patterns that are meaningless — what analysts call “noise” rather than “signal.” Not every advanced metric is actually predictive of future performance.
It’s changed the game in ways some fans don’t love. The emphasis on strikeouts (which sabermetrics shows are only slightly worse than other outs) has contributed to an era of higher strikeouts and lower contact. The shift (positioning fielders based on data about where hitters tend to hit) led to many grounders becoming easy outs. MLB eventually banned the extreme shift in 2023 partly in response to fan complaints.
The best teams today use sabermetrics as one tool among many — combining data with traditional scouting, player development, and human judgment.
Why This Matters for Baseball Fans
Understanding sabermetrics makes you a dramatically better baseball analyst — and a more interesting person to watch games with.
When you watch a pitcher who has a 4.50 ERA but a 2.80 FIP (Fielding Independent Pitching — a stat we’ll cover next time), you’ll know he’s been unlucky and is likely to improve. When you see a hitter with a .240 average but a .380 OBP, you’ll know he’s more valuable than his batting average suggests.
You’ll start to see the game the way front offices see it — not just “he’s hitting .300” but “how is he actually performing, and why?”
That’s what sabermetrics gives you: a deeper, more accurate understanding of baseball.
The Stats We’ll Cover Next
Now that you understand what sabermetrics is and why it was developed, we’re ready to dive into the specific advanced statistics.
Coming up in this series:
- Advanced Batting Stats: wOBA, wRC+, OPS+ and more
- Advanced Pitching Stats: FIP, xFIP, BABIP and more
- WAR (Wins Above Replacement): the most important stat in modern baseball
These numbers will transform how you watch and analyze the game.
See you in the next post.
— BaselineJay, CPA
This post is for informational and educational purposes only. While the author is a licensed CPA, this content does not constitute professional financial, investment, or tax advice. Always consult a qualified professional for advice specific to your situation.
Previously: Traditional Pitching Stats Explained: ERA, WHIP, Wins & Strikeouts ←
Up Next: [Advanced Batting Stats Explained: wOBA, wRC+, OPS+ and More →]